Visualizing Health Data: A Guide to Infographic Templates
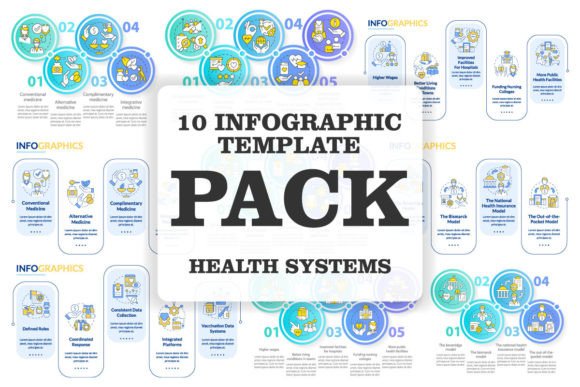
In the fast-paced world of healthcare communication, clarity is not just a luxury; it is a necessity. Whether you are a hospital administrator trying to explain patient intake procedures, a public health official tracking disease spread, or a medical blogger breaking down complex insurance policies, the ability to translate dense data into digestible visuals is paramount. This is exactly where the Healthcare System Infographic Templates bundle becomes an indispensable asset. Moving beyond generic clip art, this collection of 10 distinct infographic templates provides a structured, professional framework for presenting medical and administrative information with precision and visual appeal.
Analyzing the Bundle: More Than Just Graphics
When you first open this bundle, you aren't just getting a random assortment of shapes. You are looking at a curated analysis of how information flows within the medical field. The product file formats—EPS, JPEG, AI on white background, and SVG, PNG on transparent background—ensure that you are equipped for any medium, whether it is a high-resolution print brochure or a responsive web design. The visual personality of these templates strikes a delicate balance between clinical authority and approachable warmth. The use of clean line icons and a structured workflow layout prevents the visuals from feeling cluttered, a common pitfall in medical design where the urge to include "everything" often overwhelms the viewer.
The "personality" of this collection is distinctly modern and organized. It relies on a sans serif font approach that prioritizes readability over decorative flair. This is crucial for brand identity in the medical sector, where trust is built on the perception of competence. The templates utilize a logical visual hierarchy, guiding the eye from the headline data down to the supporting details without causing cognitive fatigue.
Practical Applications: From Data Visualization to Brand Identity
For the creative professional or entrepreneur, the versatility of these design assets is where the real value lies. Consider the "Editable Timeline Info Chart" included in the zip file. This isn't just for showing the history of medicine. A marketing strategist could repurpose this to map out a patient’s journey from symptom awareness to post-treatment recovery. A content creator could use it to visualize the timeline of a pharmaceutical research trial for a YouTube video.
The "Workflow Layout with Line Icons" is particularly effective for editorial design and internal communications. If you are designing an employee handbook for a clinic or a proposal for a new hospital wing, these templates provide the structure needed to explain complex operational steps. Because the files are fully editable in vector formats like AI and EPS, you have complete control over the color palette. You can instantly shift the color scheme to match a specific corporate identity, ensuring that every piece of content reinforces brand consistency.
Strategic Deployment of Visual Data
Using these templates effectively requires more than just drag-and-drop functionality; it requires an understanding of visual hierarchy. The bundle is designed to handle the heavy lifting of layout, but the content creator must still apply strategic thinking. For instance, when using the data visualization steps, ensure that the most critical statistic—perhaps a reduction in wait times or a success rate of a new procedure—is given the most visual weight.
For those involved in web design and social media graphics, the inclusion of transparent background PNGs is a massive workflow accelerator. You can layer these medical infographics over lifestyle photography or textured backgrounds without worrying about awkward white boxes surrounding your charts. This allows for a more integrated look on Instagram feeds or website hero sections, blending the clinical precision of the data with the human element of healthcare.
Choosing and Pairing Typography for Medical Content
While the templates come pre-structured, the typography choices you make when filling in the text boxes will determine the final impact. In the realm of medical communication, a sans serif font is almost always the preferred choice for body text due to its legibility at smaller sizes, particularly on digital screens. However, you might consider pairing a bold, geometric sans serif font for headers with a softer, humanist sans serif for the body copy to soften the clinical edge.
Avoid the temptation to use overly decorative script fonts or handwritten fonts for critical data points. While these have their place in logo design or lifestyle branding, they can compromise readability in a data-heavy context. Instead, use them sparingly—perhaps for a "callout" quote from a doctor or a patient testimonial—to add a touch of personality without sacrificing the professionalism of the medical report.
Real-World Workflow and Licensing Considerations
For small business owners and freelancers, efficiency is key. Having a zip file containing these 10 templates means you are starting the design process at 80% completion rather than 0%. You don't need to draw a heart icon or a stethoscope from scratch; the line icons are ready to scale and recolor.
However, practical guidance on licensing is essential. Since these are premium font and graphic assets, always verify the specific usage rights regarding commercial projects. Generally, assets of this nature allow for usage in end-products for clients, but redistribution of the raw source files is prohibited. This makes the bundle a sound investment for agencies and freelancers who regularly service the healthcare niche.
Ultimately, the Healthcare System Infographic Templates bundle is a robust toolkit for anyone needing to communicate complex medical information clearly. By leveraging the editable timelines and workflow layouts, and applying sound typography principles, you can transform dry statistics into compelling visual stories that educate, inform, and build trust with your audience.
Stay updated with new topics and discounts by subscribing to BSD Studio.